Shopify has introduced a great new feature in its reports called benchmarking, which helps online store owners to understand their business performance in comparison to similar stores in the same country and business.
Example
Let's say you are running a Shopify store selling organic skincare products in the US, and you notice a decline in sales. You are unsure if this trend is unique to your store or if similar stores are experiencing the same. How do you evaluate your performance and identify areas that require improvement?
Solution: Shopify Benchmarks
With Shopify's Benchmarking feature, you can compare your store's performance against other stores that have a similar order volume, are based in the same primary market, and belong to the same product categories. This comparison is highly beneficial as it helps to identify if your store is performing above average, below average, or is on par with the competition.
Key Takeaways
-
Four Reports with Benchmarks: As of May 2023, Shopify provides four benchmarking reports: online store conversions over time, average order value over time, customer cohort, and fulfillment shipping and delivery times.
-
Customization: You can select the timeframe for your reports and choose whether or not to include benchmarks.
-
Graphical Representation: The benchmark data is represented graphically, not in tables, making it visually easy to understand.
-
Contextual Understanding: With benchmarks, you can assess whether the metrics such as conversion rates or average order values are consistent with market standards.
Detailed Steps
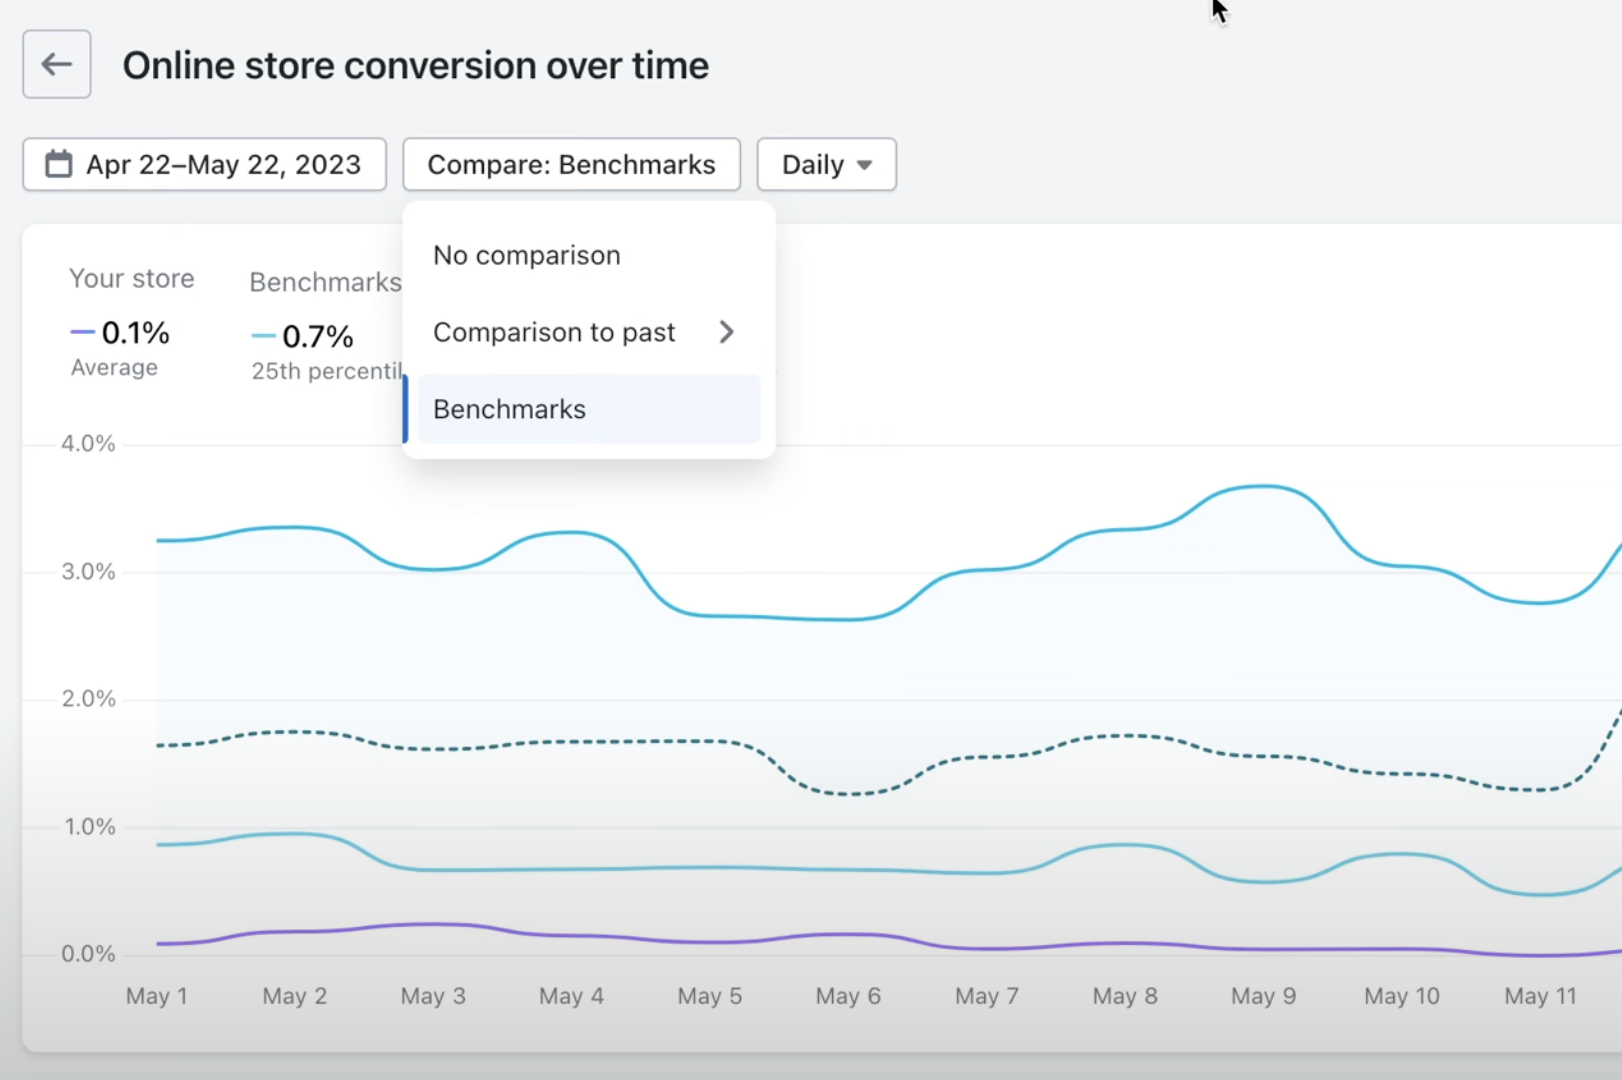
Online Store Conversions Over Time
This report shows the conversion rate of your store over time. To use it:
- Go to Shopify reports and analytics.
- Select the “online store conversions over time” report.
- Choose your timeframe.
- Enable the benchmarks option for comparison.
- Analyze the graph which will show your conversion rate compared to similar stores.
Average Order Value Over Time
- In Shopify reports, select the “average order value over time” report.
- Again, choose your timeframe and enable benchmarks.
- The graph will display the average order value of your store in comparison to others.
Customer Cohort Analysis
This report helps you understand customer retention.
- Choose the “customer cohort” report.
- Select the timeframe and enable benchmarks.
- The graph will show the percentage of visitors that return to your store compared to similar stores.
Fulfillment Shipping and Delivery Times
This report is for understanding how your fulfillment times compare.
- Select the “fulfillment shipping and delivery times” report.
- Choose your timeframe and enable benchmarks.
- The graph will show how quickly you fulfill orders compared to similar stores.
Summary
Shopify's benchmarking feature is an invaluable tool for store owners to measure their performance against the market and identify areas for improvement. By comparing metrics such as conversion rates, average order values, customer retention, and fulfillment times, you can make informed decisions to enhance your store's performance. This feature is simple and highly effective in providing insights that are crucial for your store's growth.