This question has been asked a ton lately online and in forums.
The answer really depends on your store as some store owners say the new one step checkout improves it and some say it doesn't. I've seen both positive and negatives conversion rate changes.
Luckily there's a fairly easy way to figure this out for yourself which Shopify checkout page is the best. This guide will show you how to figure it out.
Steps
"Online Store Conversion Over Time" Report
Available on All Shopify Plans, Visit the "Online store conversion over time" page by clicking on "Analytics" -> "Reports" and searching for "conversion".

In the report, you will pull out reports for the following timeframes:
- Report #1: The day you switched to "One Step" until today. (Plus "no comparison" and "weekly")
- Report #2: The same number of days from above report #1 ending in the day before you set "One Step" live. (Plus "no comparison" and "weekly")
- Report #3: The exact days from report #1 but from one year prior to be able to compare seasonality (Plus "no comparison" and "weekly")
- Report #4: Last 365 days (Plus "no comparison" and "monthly")
For each of the above 4 reports, make sure that you Export the reports and name them accorindingly so you can compare between them.

Now take all 4 reports and open them in Excel or Google Sheets. For this article, we will open in Google Sheets.
What you will be doing is referencing the columns "total_checkouts" and "total_orders_placed".
- "total_checkouts" - The number of visitors that started checkout page
- "total_orders_placed" - The number of visitors that finished successfully checking out.
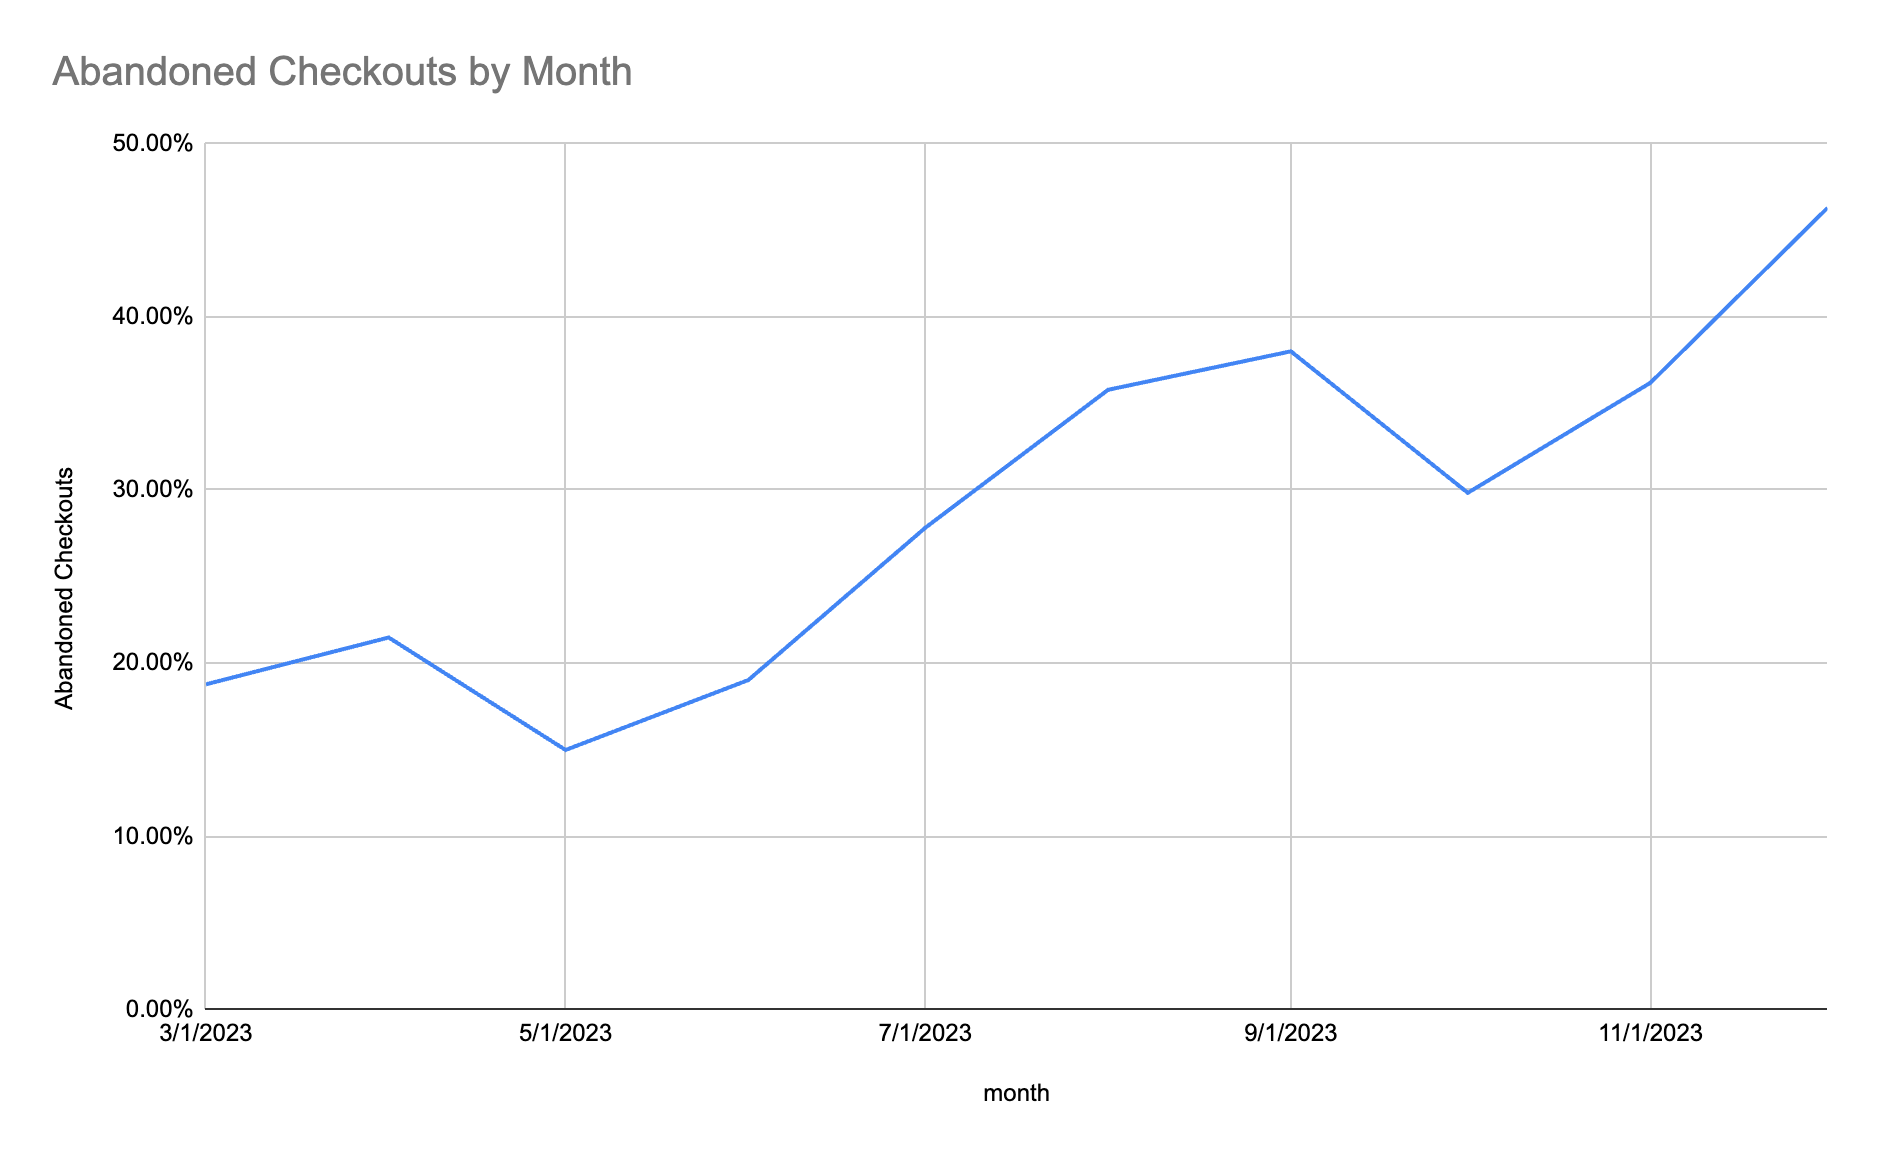
In order to calculate the percentage, we will go to a Blank Column, for example Column G, name it "Abandoned Checkouts" and add the formula "=100%-(E2/D2)" to cell G2. Then drag down the rest of the rows to calculate all of column G plus mark all of column G and change it to percentage.
This will show the percentage of checkout pages that were abandoned and didn't become an order. (NOTE - the lower the number the better).
WHICH IS BETTER?
Do this for all reports and compare the abandoned rates from before and after you checked to One Step Checkout. If the numbers are consistently more than 20% different you can consider using the better one.

A FEW IMPORTANT NOTES:
- Give it enough time and data (at minimum of 100 orders from before you changed to One Step Checkout and 100 after you changed). Note - The more traffic and orders you have to compare the better. 100 is minimum.
- Try to rule out seasonality or business specific changes. For example holiday season is very different in conversions to non-holiday season.
- Try to rule out special promotions and marketing campaigns you may have run in these dates of before and after. You may have to do work to remove extremes in your data.
Change Checkout Layout (One Step or Three Step Checkout)
See our article on how to here